
Thrombin generation
24 Sep 2024I started my PhD in 2019 at the University of Nottingham, investigating models for thrombin generation.
What is thrombin generation?
When you (well… hopefully not YOU) damage one of your blood vessels, your body needs to form a clot to stop the bleeding. This happens by exposing your blood (and it’s contents) to a protein called tissue factor (TF), which triggers coagulation through a series of enzymes called coagulation factors. These coagulation factors culminate in the production of an enzyme called thrombin, which is able to cleave the protein fibrinogen into fibrin monomers which join together to form polymers and a mesh network which traps a bunch of cells and platelets to form the blood clot.
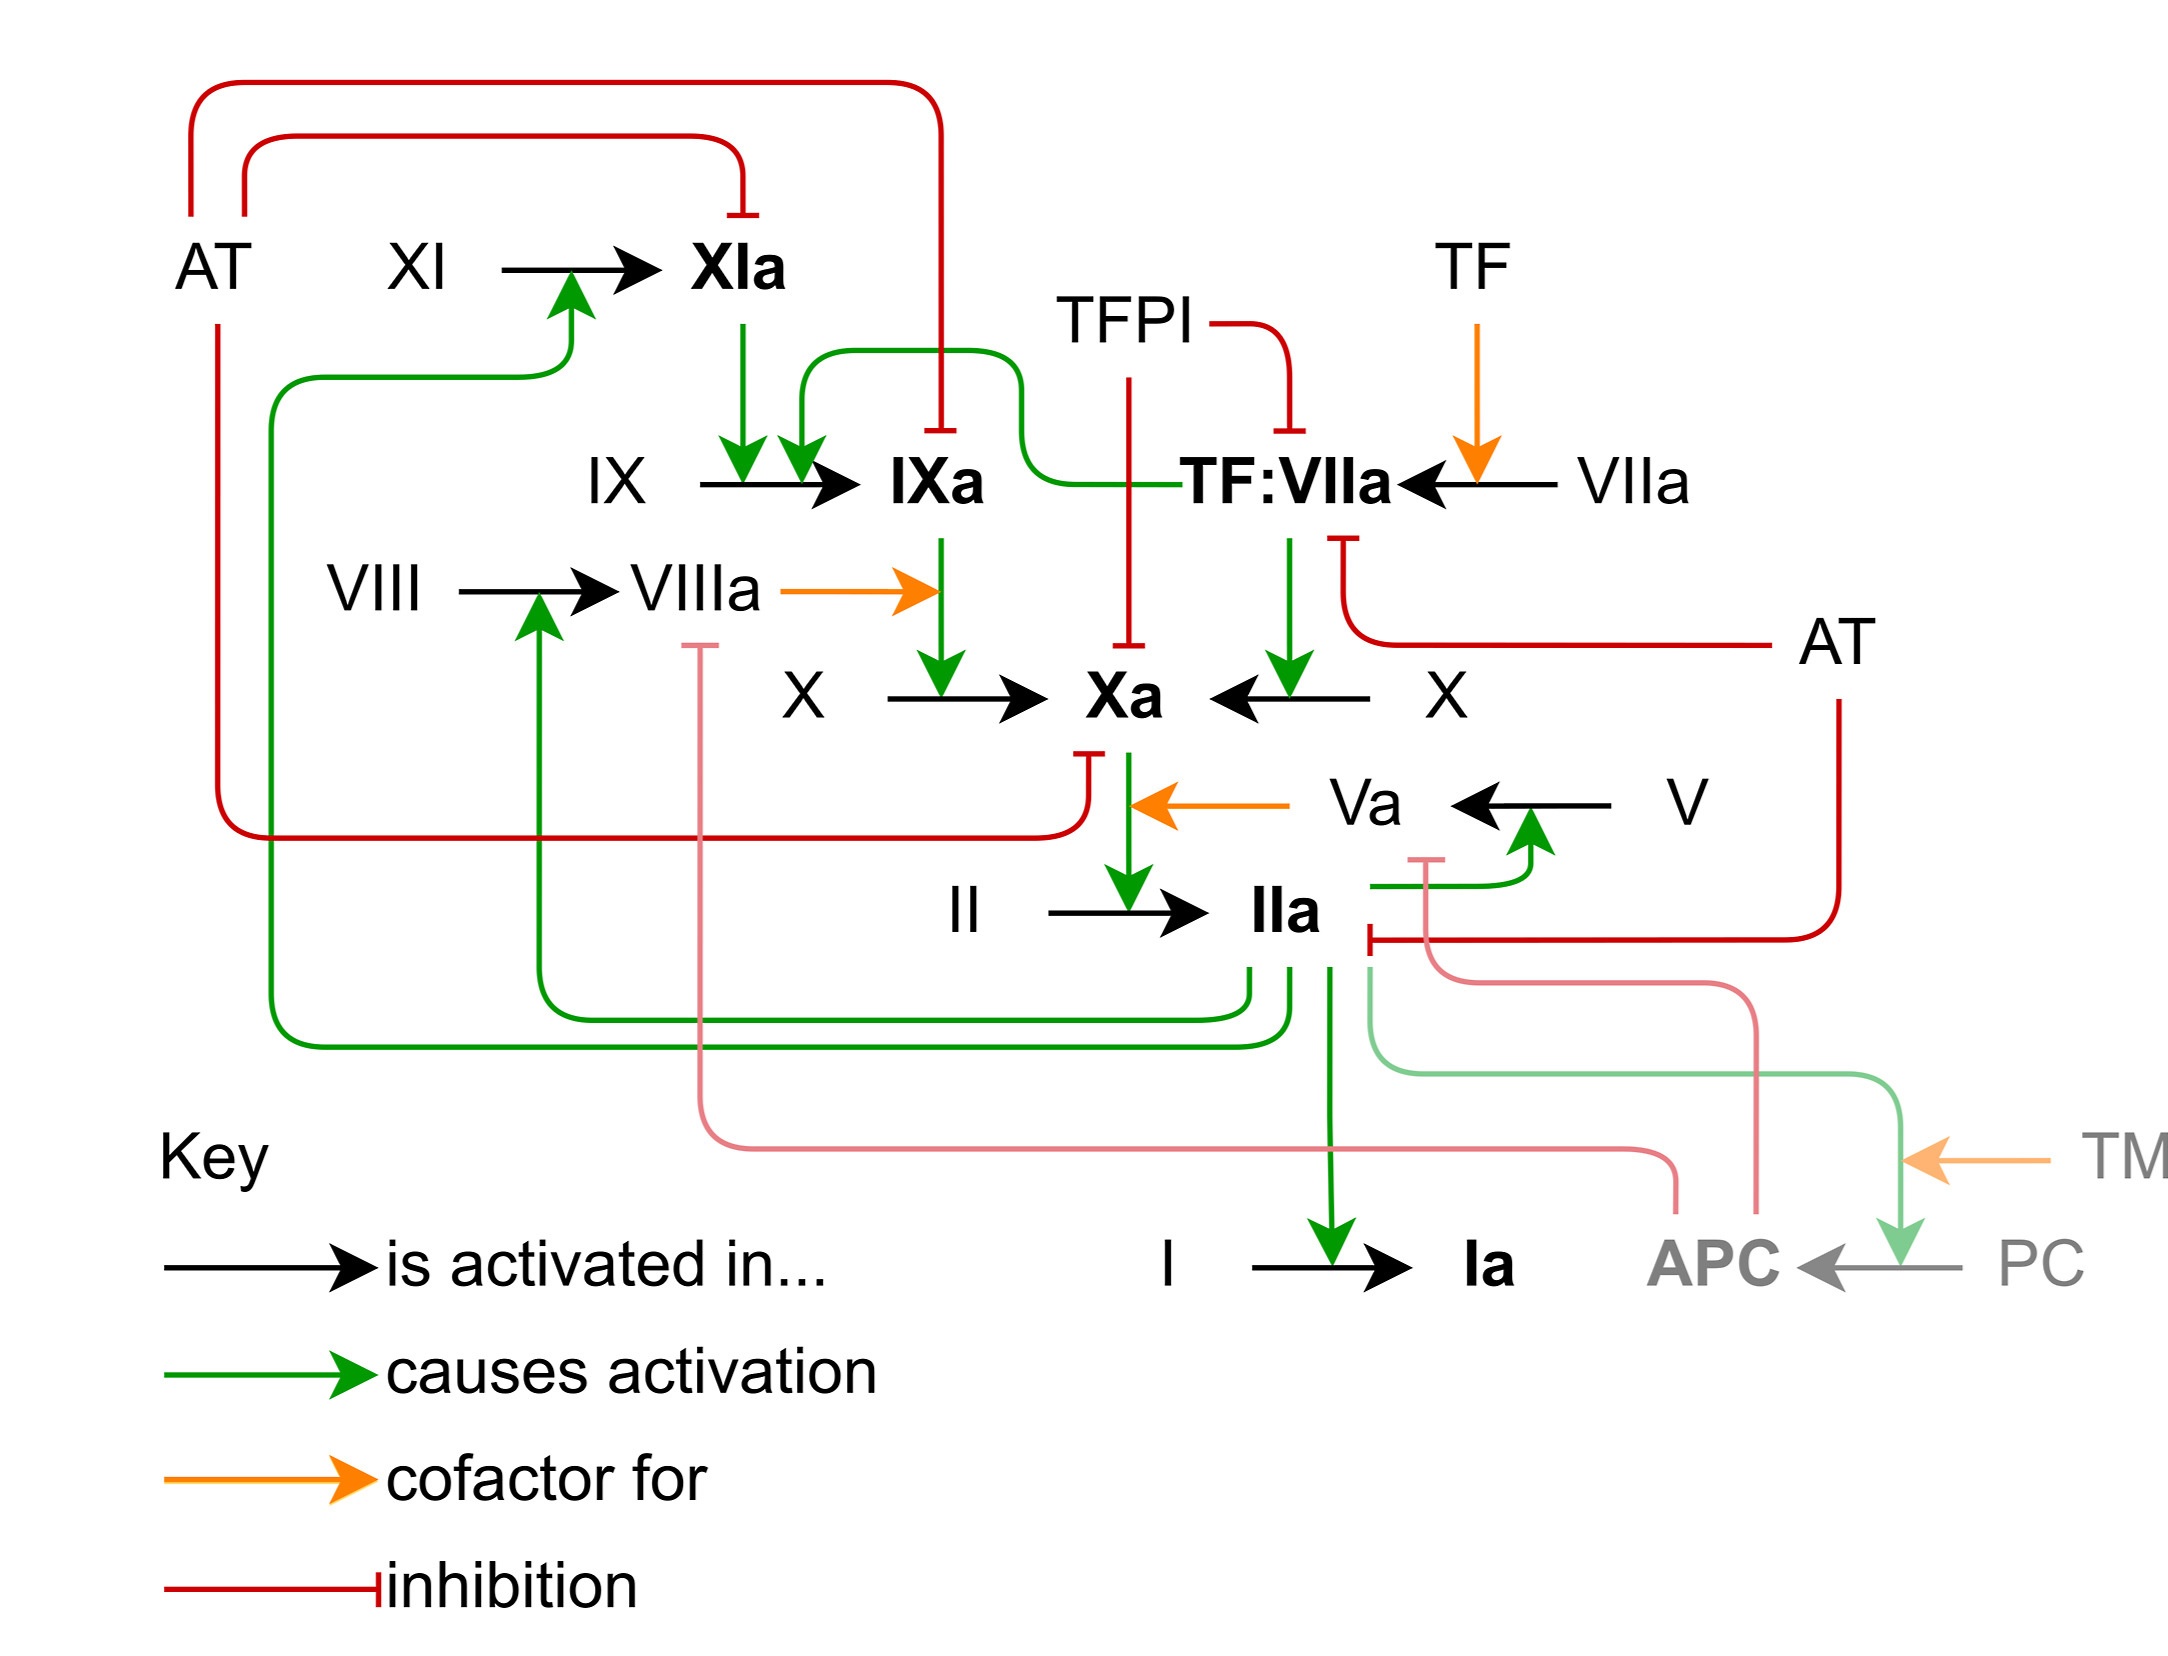
Reproduced from Owen et al. 2024 under a CC-BY licence.
Since thrombin is the only enzyme that cleaves fibrinogen into fibrin, we can evaluate how effective the blood is at clotting by measuring thrombin concentration over time in a thrombin generation assay, producing a thrombin generation curve (I know, such creative names).
Due to all the positive feedback loops, the thrombin generation curve has a short lag time before rapidly producing thrombin, which is then inhibited by things like antithrombin (AT).
Starting my work
I began my work by trying to reproduce some of the work from Chelle et al. 2018 (honestly, reproducing a paper is a great way to start a PhD).
We evaluated the same models as Chelle et al. against a data set we had that included coagulation factor concentrations (for model inputs) and ETP (a summary statistic from the thrombin generation curve).
Later on (a lot later actually, it was this year, 2024), we finalised our model selection (one we found, one recommended by a peer reviewer). We did a few different types of exploratory analysis to look at the models, including the comparison to patient data.
Sensitivity analysis
We performed something called a sensitivity analysis on each of the models. This quantifies how much the model output changes as parameters or model inputs are changed.
Our method measured the variance in a bunch of summary statistics of the thrombin generation curve after fixed variations in the model inputs/parameters.
Model investigations
We also looked into the cause for model differences. I wish I could offer a good method for this, and I did try a bunch of things. But really it just takes forever.
I did some timescale analysis (or a very computational version of it), looking at which reactions control the early stages, which control the later stages, and which are irrelevant.
I also tried to change the parameters of one model to reproduce another model, looking if reactions or parameters control the differences in the models.
Finally, looking at all the other model variables, we ended up finding that factor XI makes the biggest difference between the models (which wasn’t highlighted in the sensitivity analysis).
Are we there yet
This work (well a final version/derivative of it) was published in the Journal of Thrombosis and Haemostasis this year (Owen et al. 2024).
Post-mortem
Looking back, I’m pretty happy with how this work went. But admittedly, that’s probably because we tweaked it a lot…
I think the sensitivity analysis method could be better, looking at the derivative of model outputs with respect to model inputs/parameters would have simplified it.
We also didn’t really get as much out of the sensitivity analysis as I would have liked. Getting meaningful information out is quite challenging (rather than just model X is more sensitive to input Y than model Z). It may have been better to leave it out and simplify the paper.
We only evaluated against ETP (Endogenous Thrombin Potential; integral of thrombin generation curve) but we do have full time course data. There are some benefits to this (much simpler to explain predicted vs measured ETP rather than some sum of squared residuals costs) but the main reason is I only had ETP data when I started and I didn’t update it later on.